The Impact of Height on NHL Goalies
Rayce Ramsay
2025-04-30
Introduction
In the fast-paced and ever-changing landscape of the National Hockey League (NHL), goaltenders play a critical role in determining the outcome of games. Their ability to stop players from scoring using speed, agility, and positioning makes them one of the most scrutinized positions in professional hockey. Over the years, there has been ongoing debate regarding the ideal physical attributes of a successful goaltender, particularly when discussing height. While some argue that taller goalies have an advantage due to their greater net coverage, others suggest that shorter goalies may compensate with quicker reflexes and mobility.
This study examines the relationship between a goaltender’s height and their success in the NHL. Specifically, we analyze whether there has been a historical trend in goalie height over the past 25 years and whether this trend varies by country of origin. Additionally, we explore whether taller goalies exhibit better statistical performance as measured by save percentage (SV%) and goals against average (GAA) compared to their shorter counterparts. Answering these questions should provide insights into the evolving profile of NHL goaltenders and contribute to the broader discussion on goalie development and scouting strategies.
The data used in this study is sourced from publicly available NHL statistics, including goalie biographies and performance metrics from all seasons since 2000. This dataset has 2256 observations across 34 variables, featuring personal details such as the goaltender’s name, height, birth country, and what season they played in. Performance indicators like number of games played, number of shots faced, save percentage, and goals against average are also included per season. Additionally, we will assess a separate dataset that features the heights of officially ranked NHL goalie prospects from each draft year since 2008. This dataset includes 869 observations across 15 variables with each prospect identified as either North American or international. Finally, we will also use a team-oriented dataset to control for external factors that may impact goaltender performance. This dataset has 490 rows across 6 variables, including expected goals against, number of blocked shots, and number of defensive zone giveaways for each team and season combination since 2008. Through these datasets, we aim to provide a data-driven approach to analyzing the impact of height on NHL goaltending performance.
Methods
The goalie and prospect data for this study was mainly collected from a publicly available (but undocumented) NHL API, using two primary base URLs: https://api.nhle.com/stats/rest/ and https://api-web.nhle.com/. Since no official documentation exists, queries were structured based on an unofficial API reference guide from GitHub (https://github.com/Zmalski/NHL-API-Reference) and cross-referenced with the official NHL website (https://www.nhl.com/stats/goalies) to ensure accuracy. Two primary datasets were obtained: goalie season data, covering every NHL season (i.e. regular season and playoffs combined) since 2000, and prospect data, covering pre-NHL Entry Draft rankings for every year since 2008. The goalie season data was retrieved through a series of separate API requests for summary statistics and biographies, which were then merged using unique player and season identifiers. Similarly, prospect data was gathered through separate requests for North American and international goalies and aggregated into a single dataset. An additional column indicating prospect origin (i.e. North American or not) was added during the merging process. All data was exported to CSV files for further processing.
In contrast to the goalie and prospect data, team defense metrics were collected from https://moneypuck.com/data.htm, a third-party website that provides advanced NHL analytics. End-of-season team statistics were downloaded as a series of CSV files — one for each NHL team and season since 2008. These files were combined into a single dataset representing team-season level data. Column names and metadata that had corresponding but syntactically different entries in the goalie dataset were standardized to ensure consistency and facilitate proper merging later.
After importing the CSV files into a separate notebook, the datasets were inspected and cleaned to ensure consistency and accuracy. Data dimensions, headers, and footers were checked, column types were corrected where necessary, and missing values in key variables were assessed. In particular, discrete numeric variables had to be manually converted to integer types and certain string columns such as birth country were converted to factors for easier analysis. Special attention was given to height values, which were validated using the NHL website to confirm accuracy. Emergency backup goalies were identified and removed, as their inclusion would not provide meaningful insights into trends among regular NHL goaltenders. Additionally, missing save percentage values were discovered but left as is since this indicates a goalie who played but did not face any shots. The final rankings for 2025 prospects were also missing, but this was expected since they had not yet been released when data extraction occurred.
Several new variables were created to facilitate analysis and provide easier data validation. Age variables were derived from the birth date of goalies/prospects for both datasets. Additionally, a binary “undersized” variable was introduced to classify goalies at least two inches shorter than the league average for their respective seasons. A subset of “established” goalies was also created by filtering for goalies who had appeared in at least 25 games in a given season (or 22 for the 2024-2025 season as of March 13th). This threshold follows the NHL website’s default threshold for displaying goalie statistics and is useful for ensuring trends are true for goalies who get consistent playing time rather than one-time call-ups. Team statistics such as expected goals against, blocked shots, and defensive zone giveaways were standardized to rates per 60 minutes (rather than absolute season totals) to enable meaningful comparisons across teams and seasons.
Exploratory data analysis (EDA) was conducted using a range of visualizations and statistical summaries. Line charts were created to view trends in average goalie height over time, both league-wide and by birth country. Similar visualizations were produced for prospects, with goalies grouped by North American or international status. Histograms and table summaries were used to examine the distributions of height, SV%, GAA, and team statistics. Additionally, bar charts were generated to show the number of NHL goalies by birth country for each season. To assess the relationship between height and performance, league-wide SV% and GAA were plotted over time, both overall and with goalies grouped by undersized status. Correlations between individual attributes, performance metrics, and team statistics were assessed visually and numerically with scatterplots and correlation matrices. These tools provided a structured approach to evaluating trends in NHL goaltender height and performance over time.
Modelling and statistical analysis were conducted in R using the
mgcv, randomForest, rpart, and
pdp packages. Two sets of models were built: one to analyze
the relationship between goalie height and GAA, and another for SV%.
These two response variables differ in distributional characteristics:
GAA is a positive, continuous, typically right-skewed variable, while
SV% is a proportion bounded between 0 and 1. Accordingly, generalized
additive models (GAMs) were used for both responses with appropriate
distributional assumptions: a Gamma distribution with a log link for
GAA, and a Beta distribution with a logit link for SV%.
GAMs were selected for their flexibility in capturing non-linear relationships between predictors and the response. Smooth terms were applied to numeric variables that could plausibly affect performance. These included individual characteristics such as height, weight, and age, as well as team-level predictors like expected goals against per 60 minutes, blocked shots per 60 minutes, and defensive zone giveaways per 60 minutes. Categorical variables, including a goaltender’s team and birth country, were incorporated as random effects to account for group-level variation. A binary parametric term for the goaltender’s catching hand was also included for completeness. Model summaries were examined with a focus on the effective degrees of freedom for smooth terms and the percentage of deviance explained. The effective degrees of freedom indicate the complexity of the fitted smooth (i.e., the number of basis functions used to approximate the relationship), while deviance explained serves as an analogue to R² in non-Gaussian models. It is important to note that model performance and predictive accuracy were not the primary focus of this analysis; no train/test split or RMSE calculations were conducted. Instead, the emphasis was placed on interpretability, with the primary objective being to understand whether goalie height meaningfully impacts performance.
To further compare interpretability, each GAM was matched with a pair
of tree-based models: a regression decision tree (rpart)
and a random forest (randomForest). Decision trees provide
interpretable, rule-based splits, which can reveal height thresholds
associated with changes in SV% or GAA. Random forests, which are
ensembles of decision trees built on bootstrapped samples and random
feature subsets, were used to assess variable importance and capture
complex interactions. Partial dependence plots (PDPs) were used to
visualize the marginal effect of height on the response in tree-based
models, enabling comparison with the smooth height effects from the
GAMs. This multi-model approach allowed for a robust assessment of
whether height influences goalie performance, offering insights into
both statistical significance and practical effect size across modelling
frameworks.
Results
Variable Overview
Over the past 25 years, NHL goalies have varied in height from 5’7” (67 inches) to 6’7” (79 inches) with an average height of about 6’2” (74 inches), as seen in Table 1. Similarly, Table 3 shows that these numbers are comparable for NHL goalie prospects. This indicates a consistent preference for taller goalies in the NHL. Save percentage and goals against average show significant variation among all goalies, ranging from 0.500 to 1.000 and 0.00 to 27.23, respectively. This is largely due to inconsistencies in the number of games played for goalies. When focusing only on established goaltenders, however, SV% and GAA fall within a tighter range of .870 to 0.939 and 1.66 to 4.23, respectively, as shown in Table 2. This reflects greater stability in performance metrics for goalies with more playing time.
| Variable | Min. | 1st Qu. | Mean | Median | 3rd Qu. | Max. |
|---|---|---|---|---|---|---|
| Height (in) | 70.0 | 73.000 | 74.313 | 74.000 | 76.000 | 79.000 |
| Games Played | 1.0 | 8.000 | 28.617 | 25.000 | 45.000 | 89.000 |
| SV% | 0.5 | 0.894 | 0.901 | 0.908 | 0.917 | 1.000 |
| GAA | 0.0 | 2.455 | 2.908 | 2.768 | 3.163 | 12.315 |
| Variable | Min. | 1st Qu. | Mean | Median | 3rd Qu. | Max. |
|---|---|---|---|---|---|---|
| Height (in) | 70.000 | 73.000 | 74.359 | 74.000 | 76.000 | 79.000 |
| Games Played | 22.000 | 33.000 | 46.907 | 44.000 | 58.000 | 89.000 |
| SV% | 0.870 | 0.904 | 0.911 | 0.912 | 0.918 | 0.939 |
| GAA | 1.655 | 2.430 | 2.684 | 2.660 | 2.904 | 4.200 |
| Variable | Min. | 1st Qu. | Mean | Median | 3rd Qu. | Max. |
|---|---|---|---|---|---|---|
| Height (in) | 67 | 73 | 74.1 | 74 | 75 | 80 |
In terms of where NHL goalies have been born, Figure 1 shows how the distribution of NHL goaltenders by birth country has changed over the past 20 years. The figure illustrates how North America — particularly, Canada — has been the biggest producer of NHL goaltenders during this period. It appears, however, that the number of Canadian goalies in the NHL has gradually decreased while the number of international goalies has increased.
A bar chart displaying the top 5 most frequent birth countries of NHL goalies by season.
Figure 2 summarizes the relationships between goalie height, season, GAA, and SV%. As expected, GAA and SV% are strongly negatively correlated (r = -0.84), since a lower GAA typically coincides with a higher save percentage. Height shows only a very weak positive correlation with SV% (r = 0.03) and a near-zero correlation with GAA (r = –0.01), suggesting that there is little to no linear relationship between height and basic performance metrics. Interestingly, season is moderately correlated with GAA (r = 0.21), SV% (r = -0.20), and height (r = 0.26), indicating that goaltending performance and height has changed over time.
A matrix displaying the Pearson correlation coefficients between height, time, GAA, and SV% of established NHL goalies since the 2000-2001 season.
Trends in Height
Our analysis reveals a clear trend in NHL goaltender height over time. As shown in Figure 3, the average height of NHL goalies has increased steadily since 2000, rising from approximately 6’0.5” (72.5 inches) to roughly 6’3” (75 inches) in recent seasons. The minimum height of NHL goaltenders has also increased from 5’7” (67 inches) in 2000, to 5’10” (70 inches) in 2005, and finally to 5’11” (71 inches) in 2019, as demonstrated by Figure 4.
A line chart displaying the average height of NHL goalies by season.
A line chart displaying the minimum height of NHL goalies by season.
The upward trend in NHL goalie height appears consistent across most birth countries, though Figure 5 highlights subtle differences across the four biggest NHL goaltender-producing countries (i.e. Canada, the United States, Finland, and Sweden). Compared to goaltenders from Finland and Sweden, goalies from Canada and the United States show a relatively more consistent increase in average height. While Canada and Finland’s averages are currently around 6’3” (75 inches), the average is slightly lower for the United States at 6’2.5” (74.5 inches) and considerably higher for Sweden at around 6’4.5” (76.5 inches). Among draft-eligible prospects, Figure 6 shows a less significant pattern. Similar to NHL goalies, the average height of North American prospects has stayed close to 6’2” (74 inches) with relatively similar growth trends as the overall population. International goalies, on the other hand, have varied between 6’1” (73 inches) and 6’3” (75 inches) over the last 14 years. It is worth noting, however, that the number of ranked international goalies per year has been consistently less than the North American class, which could explain the extra variance.
A line chart displaying the average height of NHL goalies by season and birth country for the top 4 goalie-producing countries.
A line chart displaying the average height of ranked NHL goalie prospects by draft year and whether or not they were born in North America.
Trends in Performance
From a statistical perspective, NHL goaltending performance has decreased over the past decade. Figure 7 demonstrates that the league-wide average save percentage has trended downwards since the 2014-15 season, starting at 0.915 and finishing at 0.901. As expected, the league-wide goals against average increased over the same period from 2.50 in 2014-15 to 2.80 in 2024-25, while peaking at 2.96 in 2022-23. This decrease (shown in Figure 8) is likely driven by a newer generation of offensive talent who have learned increasingly dynamic and creative scoring techniques that goaltenders have not yet fully adapted to — though this remains speculative. Comparable numbers and trends are prevalent when strictly analyzing established goalies. This makes sense given that approximately 85% of the shots against and 84% of the goals against in the past 25 years have been on established goalies.
A line chart displaying the average save percentage across all NHL goalies in each season.
A line chart displaying the goals against average across all NHL goalies in each season.
Trends in Height and Performance
Visually, there appears to be little difference in performance between shorter and taller goalies. Figures 9 and 10 illustrate this by comparing the average SV% and GAA for both groups over the past 25 years. As shown in Figure 9, save percentages have remained relatively similar across most seasons, regardless of height. Likewise, Figure 10 reveals a comparable trend in GAA, suggesting that height does not play a significant role in these performance metrics.
A line chart displaying the average save percentage across all NHL goalies in each season grouped by whether the goalies are tall or short.
A line chart displaying the goals against average across all NHL goalies in each season grouped by whether the goalies are tall or short
GAA Models
The GAM for GAA, fit with a Gamma distribution and log link, explained approximately 44.1% of deviance with an adjusted R² of 0.414. The model coefficients are summarized in Table 4 and Table 5 below. Among the smooth terms included, team expected goals against per 60 minutes was by far the strongest predictor of GAA (p-value < 2e-16). Meanwhile height was not statistically significant (p-value = 0.398). The effective degrees of freedom (EDF) for the smooth height term was 1.00, indicating a nearly linear and weak effect. Visually inspecting the smooth term in Figure 11 suggests a slight negative relationship between height and GAA — meaning taller goalies tended to allow fewer goals — but the effect size was minimal and very uncertain.
| Term | edf | Ref.df | F | p-value | Significance |
|---|---|---|---|---|---|
| Season (Time) | 4.819 | 5.833 | 4.336 | 0.000 | *** |
| Height | 1.000 | 1.000 | 0.716 | 0.398 | |
| Weight | 1.000 | 1.000 | 0.012 | 0.912 | |
| Age | 1.850 | 2.342 | 1.631 | 0.210 | |
| Team Expected Goals Against Per 60 | 1.000 | 1.000 | 248.322 | 0.000 | *** |
| Team Blocked Shots Per 60 | 1.001 | 1.001 | 0.343 | 0.559 | |
| Team DZone Giveaways Per 60 | 1.000 | 1.000 | 1.233 | 0.267 | |
| Birth Country (RE) | 4.376 | 13.000 | 1.375 | 0.002 | ** |
| Team (RE) | 17.298 | 33.000 | 1.271 | 0.000 | *** |
| Term | Estimate | Std. Error | t value | p-value | Significance |
|---|---|---|---|---|---|
| Intercept | 0.980 | 0.008 | 116.596 | 0.000 | *** |
| CatchesR | 0.015 | 0.017 | 0.903 | 0.367 |
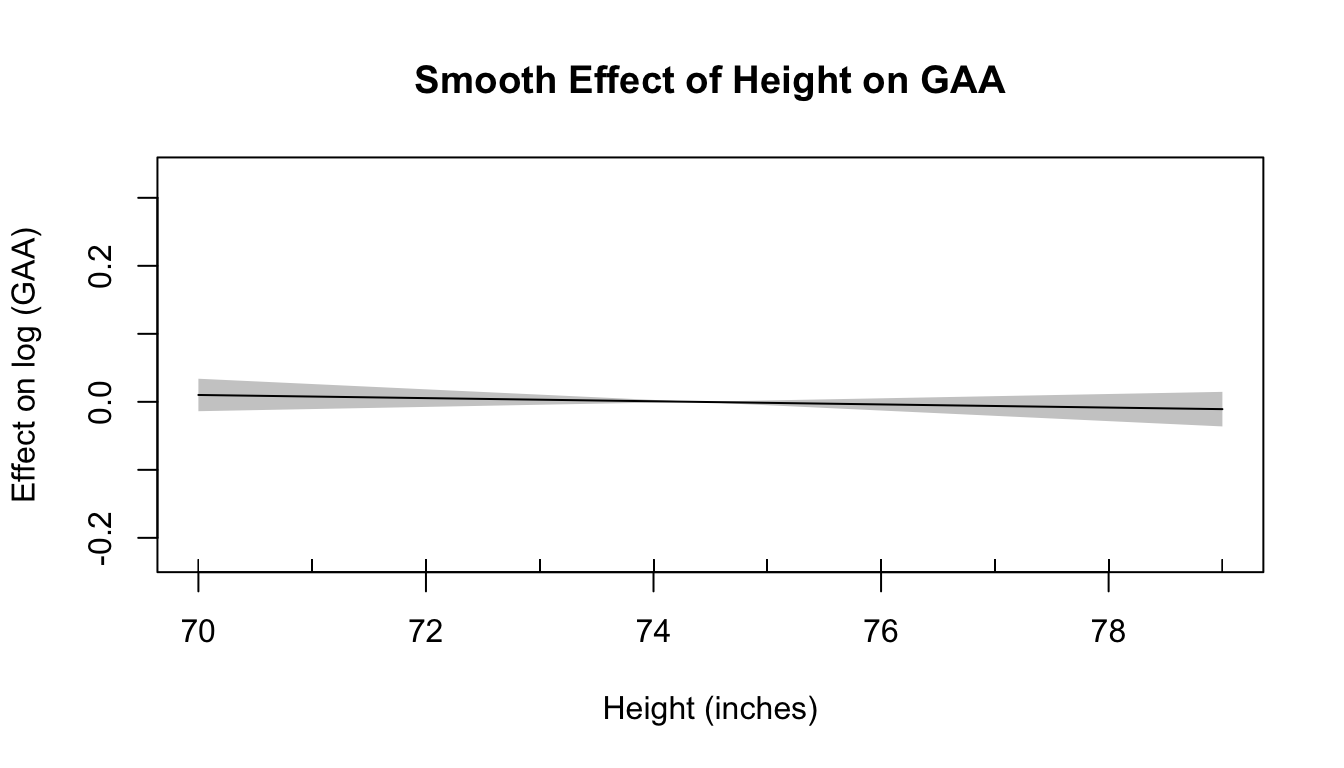
Estimated smooth effect of height on GAA and their corresponding 95% confidence intervals from the GAM with a Gamma distribution and log link.
The regression tree model for GAA did not include height among its splitting variables, as shown in Figure 12. Instead, it primarily relied on team identity, birth country, and expected goals against per 60, suggesting that contextual team factors were more predictive of GAA than physical attributes like height. This aligns with the GAM findings, where team-level defensive metrics dominated model significance.
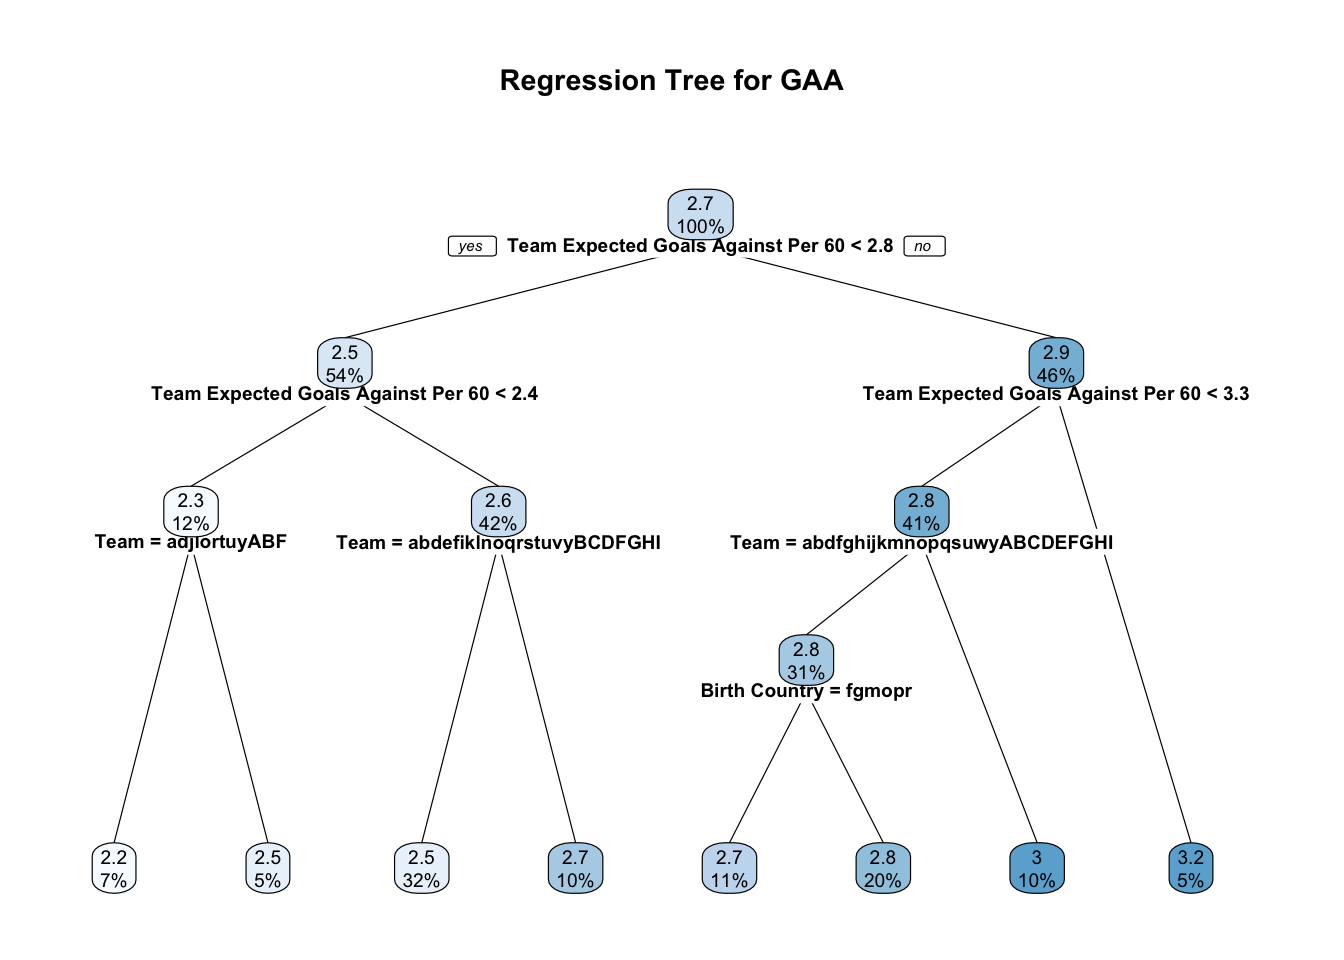
Regression tree predicting GAA using individual and team-level predictors.
Similarly, the random forest model explained 35.5% of variance, which was notably lower than the GAM. As displayed in Figure 13, variable importance rankings indicated that height was relatively unimportant, with only a 7.1% increase in mean squared error when permuted. This ranks height behind factors such as team, season, and birth country. Nonetheless, the partial dependence plot for height (shown in Figure 14) shows a weak trend consistent with the GAM: shorter goalies exhibited slightly higher GAA, though the effect was marginal and non-linear.
Variable importance plot from the random forest model predicting GAA.
Partial dependence plot showing the marginal effect of height on GAA in the random forest model.
SV% Models
The GAM for SV%, using a Beta distribution with a logit link, explained 25% of deviance with an adjusted R² of 0.215. The model coefficients are summarized in Table 6 and Table 7 below. As in the GAA model, team-level expected goals against per 60 minutes was one of the strongest predictors (p-value < 2e-16), while height was not statistically significant (p-value = 0.259). The smooth term for height had an EDF of 1.00, suggesting a weak and nearly linear relationship. As shown in Figure 15, the estimated smooth function showed a slight increase in SV% with height, but the effect size was small and not statistically meaningful.
| Term | edf | Ref.df | Chi.sq | p-value | Significance |
|---|---|---|---|---|---|
| Season (Time) | 3.210 | 3.956 | 43.443 | 0.000 | *** |
| Height | 1.000 | 1.000 | 1.272 | 0.259 | |
| Weight | 2.189 | 2.774 | 3.870 | 0.265 | |
| Age | 1.236 | 1.433 | 4.037 | 0.053 | . |
| Team Expected Goals Against Per 60 | 1.001 | 1.003 | 29.674 | 0.000 | *** |
| Team Blocked Shots Per 60 | 1.001 | 1.001 | 0.596 | 0.441 | |
| Team DZone Giveaways Per 60 | 1.001 | 1.002 | 0.035 | 0.853 | |
| Birth Country (RE) | 4.824 | 13.000 | 23.023 | 0.000 | *** |
| Team (RE) | 16.450 | 33.000 | 38.666 | 0.000 | *** |
| Term | Estimate | Std_Error | z_value | p_value | Significance |
|---|---|---|---|---|---|
| Intercept | 2.325 | 0.010 | 242.539 | 0.000 | *** |
| CatchesR | -0.004 | 0.018 | -0.230 | 0.818 |
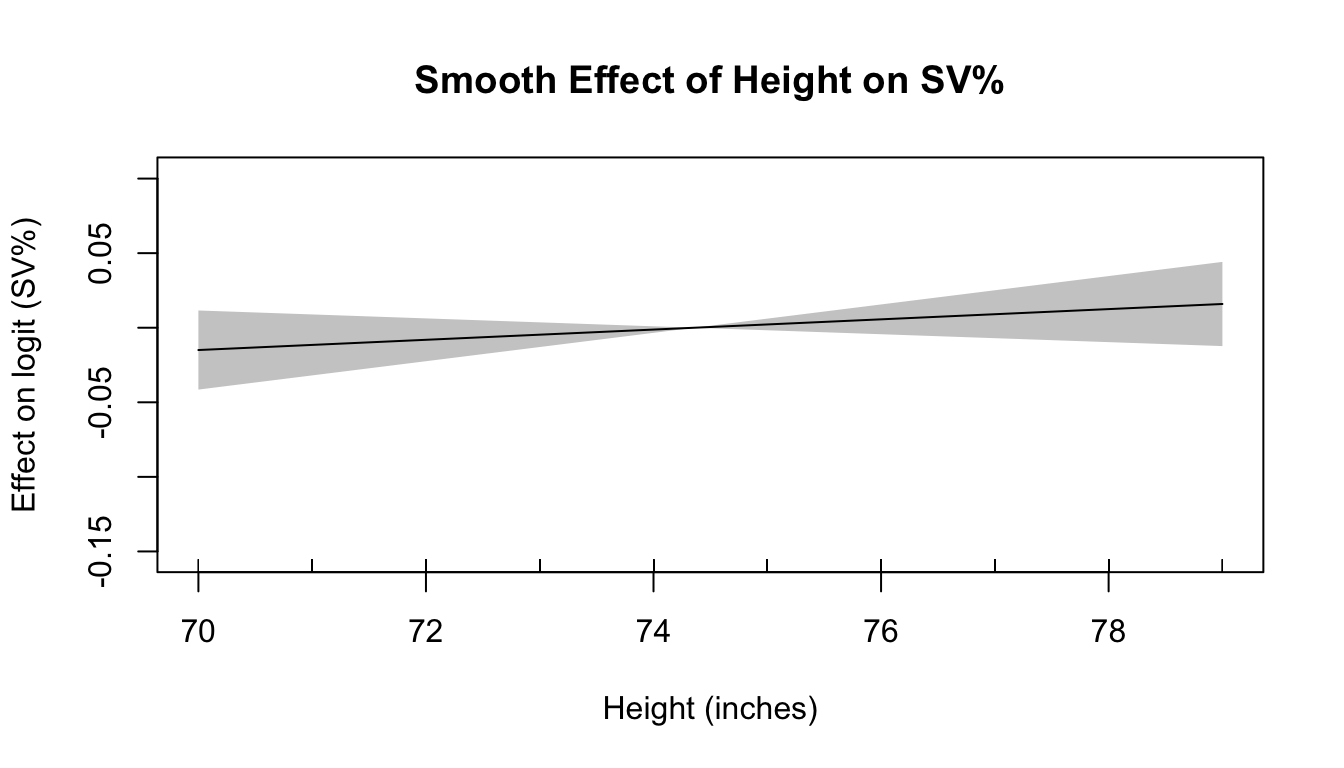
Estimated smooth effect of height on SV% and their corresponding 95% confidence intervals from the GAM with a Beta distribution and logit link.
The fitted regression decision tree for SV% similarly did not use height in any of its splits, as shown in Figure 16. Instead, the most important variables were again team identity, birth country, and expected goals against per 60, reinforcing the pattern observed in the GAA models.
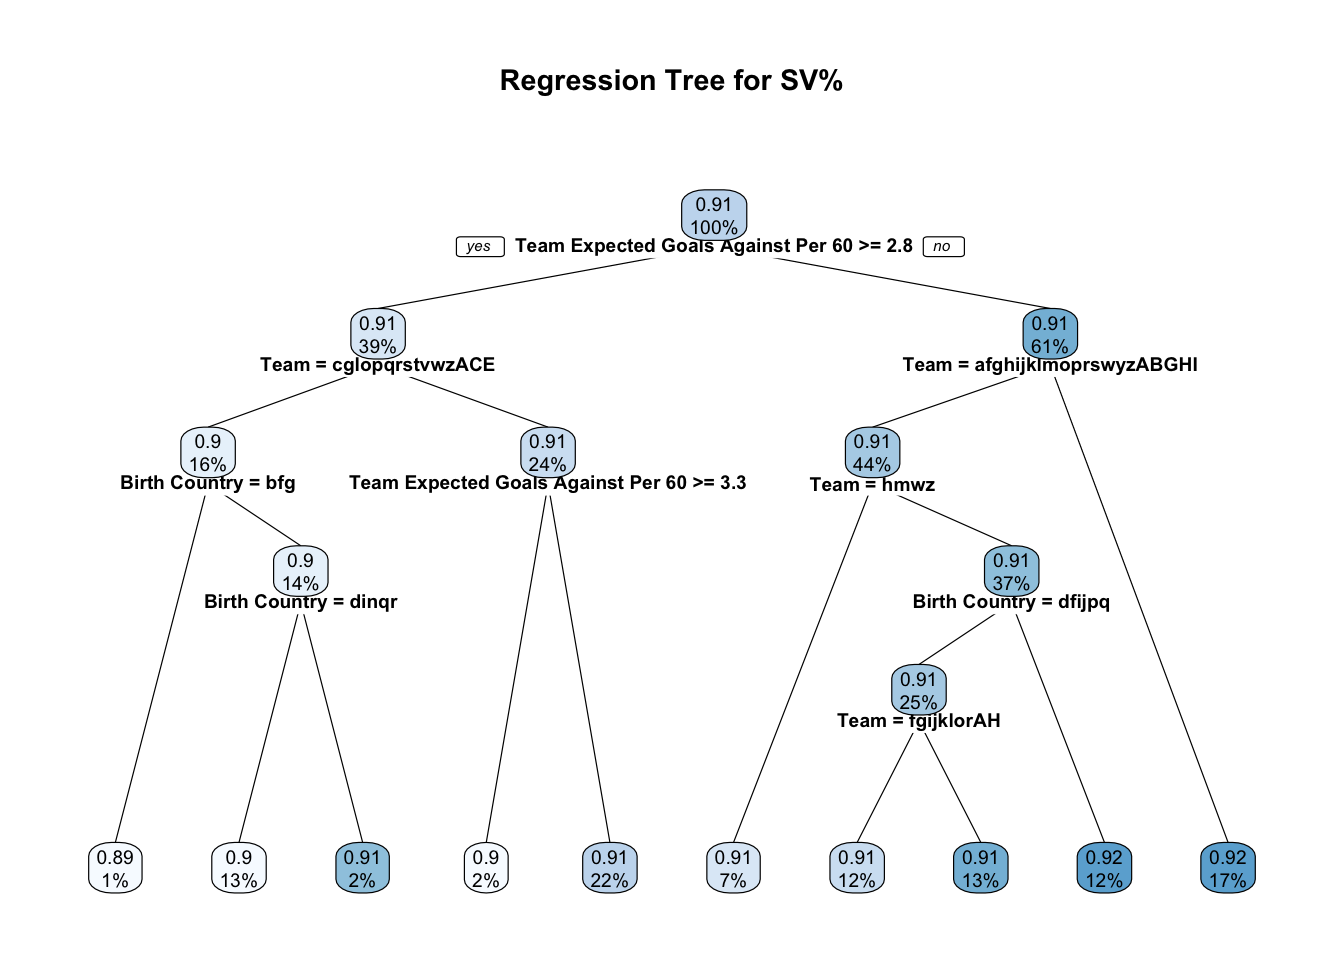
Regression tree predicting SV% using individual and team-level predictors.
The random forest model for SV% explained only 17.0% of variance, performing worse than the GAM in terms of explanatory power. As displayed in Figure 17, variable importance scores placed height near the bottom of the predictor list, with only a 7.7% increase in mean squared error when permuted — well below other features like team, season, and birth country. The partial dependence plot for height (shown in Figure 18) demonstrates a subtle, positive trend: very short goalies tend to have slightly lower SV%, but this relationship is weak and potentially misleading.
Variable importance plot from the random forest model predicting SV%.
Partial dependence plot showing the marginal effect of height on SV% in the random forest model.
Conclusions and Summary
This analysis confirms that NHL goaltenders have become increasingly taller over the past 25 years, reinforcing the league’s apparent preference for taller goalies. This trend is consistent across most major goaltender-producing countries, with Sweden currently leading the way in average goaltender height. A similar, though more variable, pattern was observed in drafted goalie prospects, especially among international players.
The demographic landscape of NHL goaltending has also shifted over time. While Canadian goalies once dominated the position, there has been a noticeable decline in their relative presence, coinciding with a rise in international goaltenders. This reflects a broader globalization of goalie development, with more countries now producing NHL-caliber talent.
However, despite the league’s growing emphasis on taller goalies, the modelling results suggest that height alone is not a strong determinant of performance. Across both SV% and GAA, GAMs indicated that height had at most a weak, linear relationship with performance metrics — one that was not statistically significant in either model. Tree-based models reinforced this result, as height did not emerge as a key predictor in any decision paths or variable importance rankings. Instead, team context (e.g., team-level expected goals against) and birth country were consistently more influential predictors of goaltender performance.
Although the smooth functions in the GAMs and partial dependence plots in the random forests suggest that shorter goalies may underperform slightly, especially at the extremes, these trends were subtle and may reflect other correlated factors such as experience or team quality.
Importantly, these findings should be interpreted with several limitations in mind. The analysis focused on high-level summary metrics (GAA and SV%), which, while widely used, do not capture finer aspects of goaltender performance like shot quality faced, rebound control, or positioning. Additionally, the models were not validated on separate test data, as the primary aim was to explore interpretable patterns rather than maximize predictive accuracy. Finally, although height was modelled flexibly, potential interactions with playing style, coaching systems, or workload were not explicitly tested and could influence performance in more subtle ways.
Overall, while taller goalies continue to be favored in NHL scouting and development, there is little statistical evidence that height alone is a meaningful driver of performance. Instead, goaltender success appears to depend more on situational context, skill, and team environment than on physical stature.